- Public Market Financials & Transactions
- Business Appraiser Databases
- See Bundles
- ADD TO CART
Guideline Public Company Database
BRAND NEW Application, powered by TagniFi data.
ValuSource’s Guideline Public Company application has been completely rewritten and substantially enhanced. First, the data is now from TagniFi and includes pricing data to calculate multiples and second, there is a completely new interface to make finding and using guideline data much easier.
You can select up to 20 companies and download income statements, balance sheets, cash flows and ratios based on annual, quarterly, year to date and trailing 12-month time frames. You can also download a Multiples analysis that provides the multiples needed for valuation purposes.
This tool allows you to download more Guideline data faster than anything else available!
“Fantastic addition to the BVDataWorld website. This database alone is worth the membership.”
Peter H. Agrapides, MBA, CVA
Click the links below for sample data:
Five reasons to consider Guideline Public Company Database
- Standards – Valuation standards specify that the public company data at least be considered when performing a valuation, even if you decide there are not any comparable public companies.
- Transparency – The data is collected from public SEC filings and is compiled to be both consistent and standardized over time.
- Enhanced Searching – There is both a standard and detailed search allowing you to find the companies you are looking for quickly. You can also “select” companies across multiple searches, making it very easy to find the set of companies that you need.
- Data – With a single-click, you can download income statements, balance sheets, cash flows, ratios for annual, quarterly, Year-to-Date and Trailing 12 Month periods. You can also download a Multiples analysis that provides the multiples needed for valuation purposes.
- TagniFi Data Source– ValuSource’s application is powered by TagniFi data, which is one of the most respected sources of public company information available. The data also includes pricing data so multiples can be calculated as of the valuation date.
How it works – Four simple steps to get the data you need
Step 1: Select the Companies
Use either the Standard or Detailed search tab to enter the criteria you want to search on. In this case we selected SIC 5812 (restaurants), description “pizza” with a valuation date 12/31/16, with a cut off date of 4/1/2017. Then select the companies you want to include in the “Selected Records” list by checking the checkbox in the first column. You can perform multiple searches and any record (up to 20) will appear in the Selected Records tab.
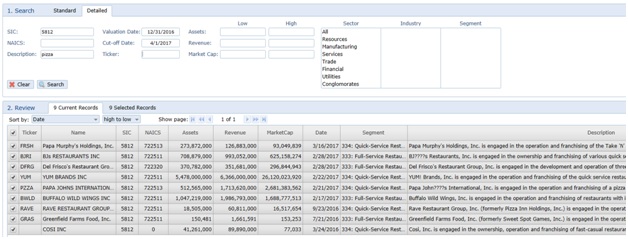
Click the checkbox on the left column to add the company to the Selected Records List. To view and edit the Selected Records list, select the “Selected Records” tab.

Step 2: Export Fundamental Data
![]()
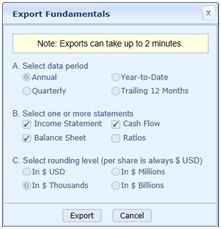
Once you have selected all the companies you want to export, select the Fundamentals Export button. You will see the following dialog box which allows you to select both what statements you want and what period you want. Select Export and all the data will be exported to a single Excel file.
Step 3: Reviewing Exported Fundamental Data
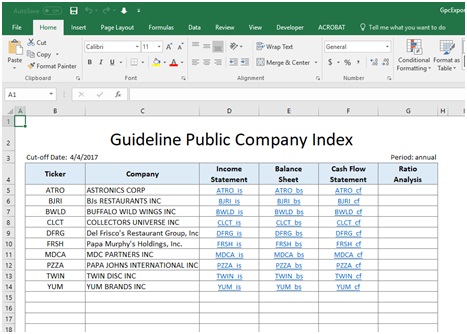
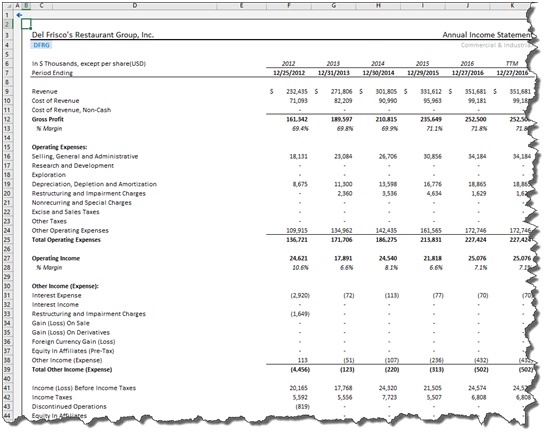
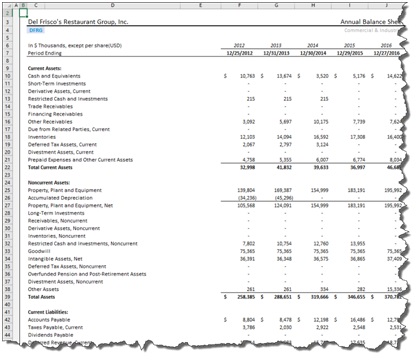
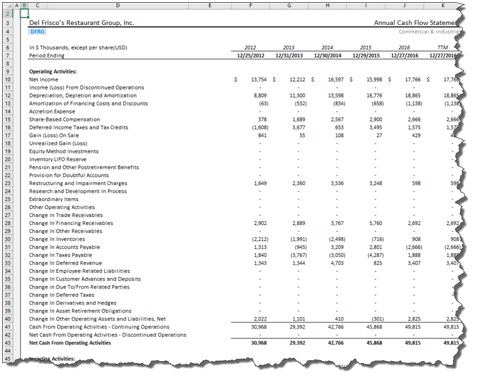
Once the data is exported you can open the Excel file and review all the data. The first tab is a table of contents showing you a list of every company and all the statements you wanted to download. Simply click on one of the statements and that tab will be shown.
Income Statement
Balance Sheet
Cash Flow Sheet
Step 4: Export Multiples Data
![]()
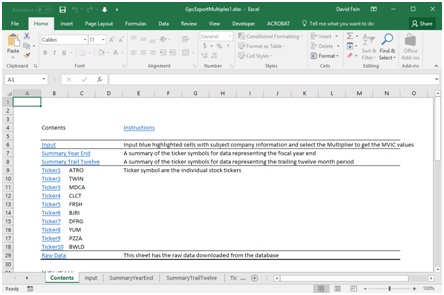
Select the Multiples Export button and an Excel file will be exported with all the data necessary to calculate multiples as of the valuation date. There are a number of Excel worksheets (tabs) including an index tab, subject company input, year end summary data, trailing 12 month summary data, data for every company you downloaded (i.e. ticker) and the raw data download. The multiples that are calculated include MVIC to Sales, MVIC to EBITDA, MVIC to EBIT and MVIC to Gross Profit.
Table of Contents
This page shows the table of contents for the workbook. The detailed data for each company is also included in this list.
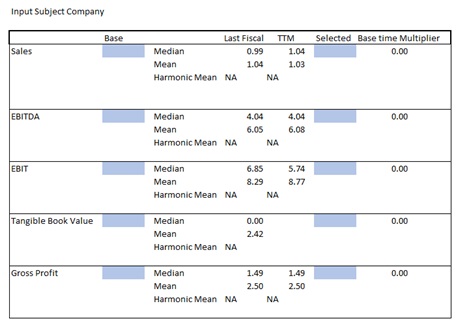
Subject Company Input
Enter the data for your subject company and it will be compared to the aggregate data (median, mean, etc.) for the public companies you selected.
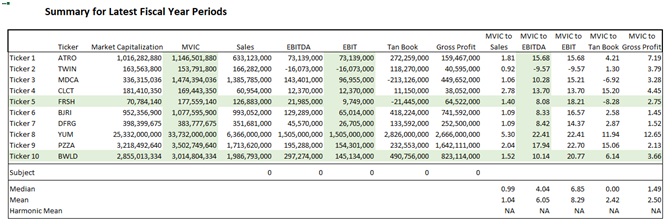
Summary for Latest Fiscal Year
This screen shows each company you selected with the MIVIC and MVIC multiples based on the valuation date you entered.
