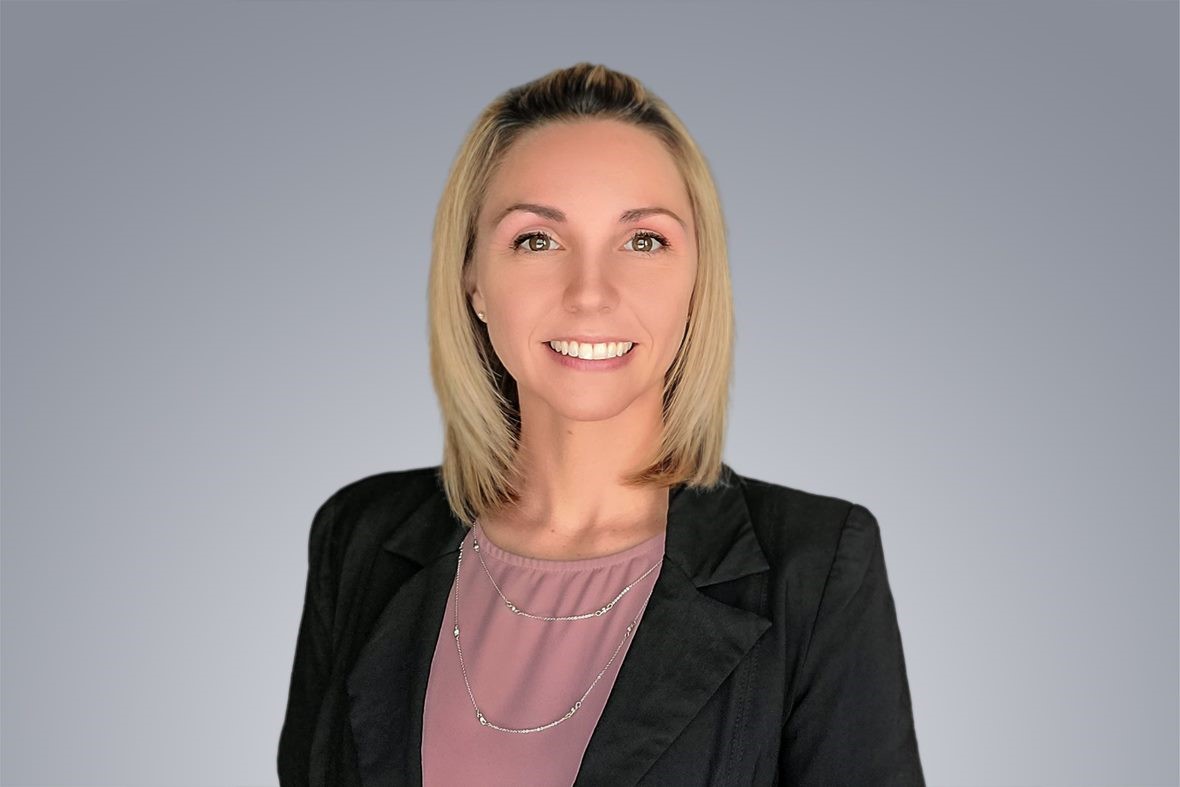
ValuSource’s CEO David Fein discusses RMA’s rich history and rich data with Shea Scarpa and Carly Edmondson
Overview
ValuSource has been working with RMA for over 30 years to provide the business valuation community access to RMA Annual Statement Studies data, for both our valuation software and Excel users. In 2005 we came to RMA with a proposal to create the RMA Statement Studies Valuation Edition for valuators. ValuSource worked closely with RMA to create the Valuation Edition, which provides information in the form of decile data (i.e., every percentile from 10-90) for every common size and ratio variable, which helps valuators get a more precise picture of a company’s risk compared to their peers.
RMA is one of ValuSource’s first partners from our early days and we wanted to help our customers understand both the fascinating history of RMA, and details about how RMA compiles, processes, and publishes the RMA Annual Statement Studies data.
The following is a summary of David Fein’s conversation with Shea Scarpa, Product Manager, and Carly Edmondson, Senior Product Manager, of RMA.
David: RMA has a long and interesting history; Shea, please tell us more about it.
Shea: It sure does! At the start of the 20th century, business owners typically did not report annual filings to their stakeholders, but as companies grew and formal agencies were formed, there was a greater emphasis on the credit process and a need for financial statements.
In 1913 the National Association of Credit Men (NACM) and the National Shawmut Bank called a meeting in Boston for visiting bankers, 82 men attended it. They reconvened the following year and called themselves the Robert Morris Club.
On the second day of the meeting, the New York Times reported that HB Claflin, a Manhattan-based wholesaler, overextended notes held by 5,000 banks. As a result, ten of the Credit Men left the meeting to return to their banks and clean up the mess. This prompted the Robert Morris Club to establish relationships between banks to prevent such losses, while also improving bank credit tools and procedures.
By 1920, the club’s name officially changed to the Robert Morris Associates, with its primary focus being the exchange of credit information on commercial paper customers. Over the next 100 years, Robert Morris Associates evolved into RMA. While we continue to have a strong focus on credit, RMA has expanded into other risk disciplines, including market and securities lending, operational and enterprise risk, climate risk, and regulatory affairs. More recently, we relaunched our brand, introduced a new membership model, and continue to support and engage Members.
David: How did RMA Annual Statement Studies benchmarking data come about?
Shea: RMA Annual Statement Studies is the flagship product of the Robert Morris Club and continues to be one of the most highly valued credit products. Before the organization was formally incorporated, the co-founder and leader of the club, Alexander Wall, established a series of metrics that could further quantify the financial condition of borrowers by comparing them to their peers.
He first discussed his metrics in the ‘Study of Credit Barometrics,’ published in 1919 in the Federal Reserve Bulletin. Wall was able to compile seven financial benchmarks for 30 industries, compiled from 1,700 financial statements. This effort developed into the 1st Annual Statement Studies, published in 1925.
Through the 1960s and 70s, the data grew exponentially. Cash flow data was introduced in 1999, followed by a more modern way of accessing the information through eStatement Studies in 2003. Today, eStatement Studies features regional level breakouts, sector level reporting at the two-, three-, four-, and five-digit NAICS codes, and more recently we have added the EBITDA ratios to the output.
David: Do you have a sense of what the reach is of RMA data in the banking industry for commercial loan valuation?
Shea: A very high percentage of banks and credit unions use RMA benchmarking daily and can access the data in various ways either directly, or through partnered software vendors. I will also mention that of all of our user base (banking and non-banking), over the past 12 months there have been more than 20,000 industry reports downloaded!
David: How many banks are there in the U.S.?
Carly: The number of banks in the U.S. is shrinking rapidly due to factors such as mergers and competition. In 2000, there were close to 8,000 banks, but by 2020, that number dropped to 4,300 banks. I’d estimate that in the next five years, this number will drop closer to 3,000.
David: How is the data collected and processed?
Shea: RMA relies on relationships with our member institutions – financial lending institutions. First, we partner with software vendors who sell financial spreading tools to banks and who will build our data specifications as an ‘RMA Submission Utility’ on the back end of their software. Once a bank becomes a client of the software vendor and begins spreading financials, they can voluntarily and securely generate the ‘RMA Submission’ file and send it to RMA.
This process is known as our Annual Submission Campaign, which happens each year between April and August. Once RMA receives the Members’ encrypted submission file, we complete an initial processing of the file which includes the initial validations to accept or reject a statement. We close the campaign in August, then get to work with our contracted data programmer to begin scrubbing the data, performing validation checks, compiling, and crunching the data, testing, and moving the final data points into production. Once all data files are in a deliverable format, RMA launches the new data set on November 1st each year. For more detailed information on how we obtain the data, what we collect, and who participates in this program, visit our Submission Information website.
David: Can you discuss data requirements and process transparency in RMA data?
Shea: RMA has a specific set of data requirements, which are relatively general to facilitate comparisons. By this I mean we are collecting THOUSANDs of financial statements from several hundred industries – last year we collected over 200,000 statements. While all industries and businesses follow GAAP, there are some unique transactions and considerations to some of them and these must be taken into consideration when we look at their financial statements.
Our ‘rules’ are what keep the data transparent in nature – essentially, it is easy to form an opinion on a company or industry’s performance based on what the numbers reveal. We also make everything public – the data definitions, formulas, and even data templates for submitting financial statements. There is no huge secret behind the benchmarks, the numbers tell the story. Our spreading guide is also freely available.
David: Why is RMA data unique and valuable?
Shea: The number one reason Annual Statement Studies data is unique is because it is sourced strictly from RMA Members. Our users often say how valuable our data is because it is derived specifically from the lenders themselves. This makes it more reliable and trusted, especially among their peers.
Carly: And just to add, speaking as an ex-banker, the financial statements that are gathered from banks are typically held to a higher standard because RMA supplies credit and commercial training to many of the individuals that spread the company financials. The RMA Guide to Spreading Financial Statements is widely used in the industry, so common practices remain in place amongst our contributors.
Shea: That’s right! And lastly, our subscribers (non-bankers) often refer to the Annual Statement Studies as the ‘Gold Standard’ for credit benchmarking, which is an honor. It’s such a good feeling to know that what we are producing for financial professionals is of so much value and plays such an important role in their job.
David: Who are the key people involved in the collection/processing of the data?
Shea: Our team is made up of:
- First our Member Institutions – typically those folks in credit; credit administration, credit analyst, portfolio managers, lending officers
- Statement Studies Product Manager, Shea Scarpa Gardner
- An RMA contracted data programmer, who has been contracting with RMA for more than 40 years
- Our internal IT Team
David: How do banks use RMA data?
Shea: Bankers use Annual Statement Studies data during the lending process, and again during the underwriting process. Since banks are most concerned with the borrower’s ability to repay its debt, the data is used to help the bank in its analysis of the company’s financial condition.
Carly: The first step in the underwriting process requires a request for a company’s financial statements, which an analyst then spreads based on common guidelines Then there will be conversations about the general strength of their financial statements. They’ll look at things like cash flow measures, margins, and profitability.
Determining the health of the business is different by industry. There are many industries where a 4% gross margin or 4% net profit margin is healthy. There are some industries where that would be terrible, and you’d typically see a 20% gross profit margin.
In addition to helping the banker understand the health of the company’s financial position, RMA Statement Studies can be used to help determine the structure of the loan. Depending on what peers’ financials demonstrate, the bank may recommend a certain type of loan. As an example, if margins are strong but the bank has liquidity challenges seasonally, they may just need a revolving loan to help support their working capital. Or if their interest expense is unreasonably high, they may need to look at refinancing. Finally, the presence of many years of historical data helps the banker form projections, conduct sensitivity analyses, and set covenants, among other uses.
David: What is the most significant benefit for valuators who use RMA data?
Carly: By using RMA benchmarking data, valuators get a better understanding of the industry and the historical trends of those industries. And the fact that you can look so far back into the past with our resource means you can track performance over time compared to economic factors or events. For example, looking back at factors such as margins, liquidity ratios, and leverage in 2008 and 2009 will help you assess how recession-proof the industry is.
David: What’s your vision for the future of RMA data?
Shea: First, I am happy to share that a new eStatement Studies interface is set to be released later this year! We are currently working with our vendor to provide a more user-friendly, and more modern platform.
For future data expansion, my vision would be to have all 1,600 RMA members take part in our collection efforts! The data is only as strong as the effort that goes into compiling it. It is a product that is created by Banks for Banks, so we heavily rely on the support of our members. I’d like to see an expansion of the ratios that we currently offer, in addition to perhaps expanding our geographical footprint internationally.
Finally, I would be interested in spending more time talking to our non-bank users, like valuators, to decide how we can improve the data and make their lives easier.
David: Do you see AI entering banks/valuators’ world when it comes to financial statement benchmarking?
Carly: Absolutely, we are experimenting with AI. I know several banks are using optical character recognition to input their data and then they have a human who ensures that it’s all correct.

As Manager, Business Solutions, Shea Scarpa Gardner is responsible for the daily promotion, production, distribution, and support of the Annual Statement Studies product. Prior to managing RMA’s flagship product, Shea worked in RMA’s Finance Department as an Accounts Receivable Representative. Shea holds a B.S. in Finance from the Rutgers School of Business.

As a Senior Product Manager, Carly Edmondson is responsible for three RMA products: eMentor; Credit Risk Navigator, powered by AFS; and Risk Maturity Framework. Prior to working at RMA, Carly was a commercial credit analyst and underwriter at Capital One. Carly holds a B.S. in Finance from Tulane University.
